How to Calculate Event ROI, Revenue, and Total Costs

An event ROI presentation for executives should show the return as a percentage: subtract total event costs from event gains, divide by total costs, then multiply by 100. Separate closed revenue from pipeline and projected revenue so leaders can distinguish realised results from potential value. Include direct and soft costs in the calculation.
A strong return on paper doesn’t automatically make an event the best-performing channel. The comparison depends on what each channel was designed to achieve, how value is attributed, and whether the same costs and outcomes are being measured. Revenue, pipeline, brand awareness and relationship-building can all matter, but they aren’t interchangeable.
This guide explains how to calculate event ROI across closed revenue, pipeline and projected revenue, account for the full investment, and assess results against KPIs and other marketing channels. It also shows how to present the figures clearly, with assumptions visible and outcomes separated, so executives can see what the event delivered and where longer-term value may emerge.
Key Takeaways
• Calculate ROI by comparing event gains with total costs, and keep closed revenue distinct from pipeline and projected revenue.
• Include soft costs alongside visible expenses to build a more complete picture of the event investment.
• Track attendance and engagement in ways that connect activity to meaningful business outcomes.
• Set KPIs before the event, then assess performance against those measures and the event’s original objectives.
• Compare channels on consistent terms, accounting for their different goals, attribution windows and forms of value.
Event ROI formulas for closed revenue, pipeline, and projected revenue
Calculate event ROI using closed revenue first, then show pipeline and projected revenue separately. This distinguishes realised gains from estimates and gives executives a clear view of attribution.
•
Count direct and indirect event revenue
Calculate ROI as (event gains − event costs) ÷ event costs × 100. Count direct revenue, such as ticket sales or deals closed after attendance, and identify indirect value separately, such as qualified pipeline created through event conversations.
A conference generating $50,000 in ticket sales and $500,000 in closed deals over the following quarter illustrates two direct revenue streams. Don’t add the same deal to both event revenue and pipeline. A $40,000 virtual event producing $160,000 in closed-won revenue calculates to 300% ROI.
A realistic benchmark varies by event objective and industry; there is no single target for every format. A 3:1 ROI may be strong for brand awareness but weak for a sales conference, so define the goal before comparing results.
•
Separate sourced revenue from influenced revenue
Label revenue as sourced when the event originated the opportunity, and influenced when it contributed to an existing sales journey. Report each category separately, then show any combined view with its attribution method clearly stated.
For an executive forum, directly attributed revenue reached $210,000 over six months, whilst influenced pipeline was $620,000. The example reports 147% ROI on directly attributed revenue and 244% adjusted ROI with conservatively weighted pipeline. Apply a 20% close rate to remaining pipeline, and avoid presenting influenced value as closed revenue.
Long sales cycles require a defined measurement window. Most B2B teams use a 90- to 180-day attribution window aligned with their sales cycle, which can run 60-180 days.
•
Review metrics across event stages
Define revenue-focused metrics before the event, including target accounts, expected opportunities and the revenue objective. During the event, record qualified conversations, meetings and opportunities created, and link each record to its source.
After the event, measure pipeline creation and influence at 30-, 60- and 90-day intervals. Track closed-won revenue alongside projected revenue, not instead of it.
Make assumptions visible. A forecast is not a closed deal, and changing the win rate changes projected value.
•
Monitor revenue and channel ROI
Segment revenue by channel to calculate channel ROI as well as overall event ROI. Compare equivalent outcomes and attribution windows. Don’t rank a relationship-led forum against a demand-generation campaign using closed revenue alone.
Common reporting risks include double-counting, treating all pipeline as certain and stopping measurement before the sales cycle matures. Executives should review sourced revenue, influenced pipeline, projected value and cost together, then decide whether to repeat, refine or redirect investment.
Use the event’s stated objective to judge its result. The example of $800,000 qualified pipeline from a $40,000 investment reports 1,900% pipeline ROI within 90 days, but pipeline ROI remains distinct from closed-revenue ROI.
Event cost calculation, including soft costs
Build the cost base before assessing an event’s return. A complete calculation combines direct expenses with staff time and other soft costs, then applies that total consistently.
•
Calculate total event costs
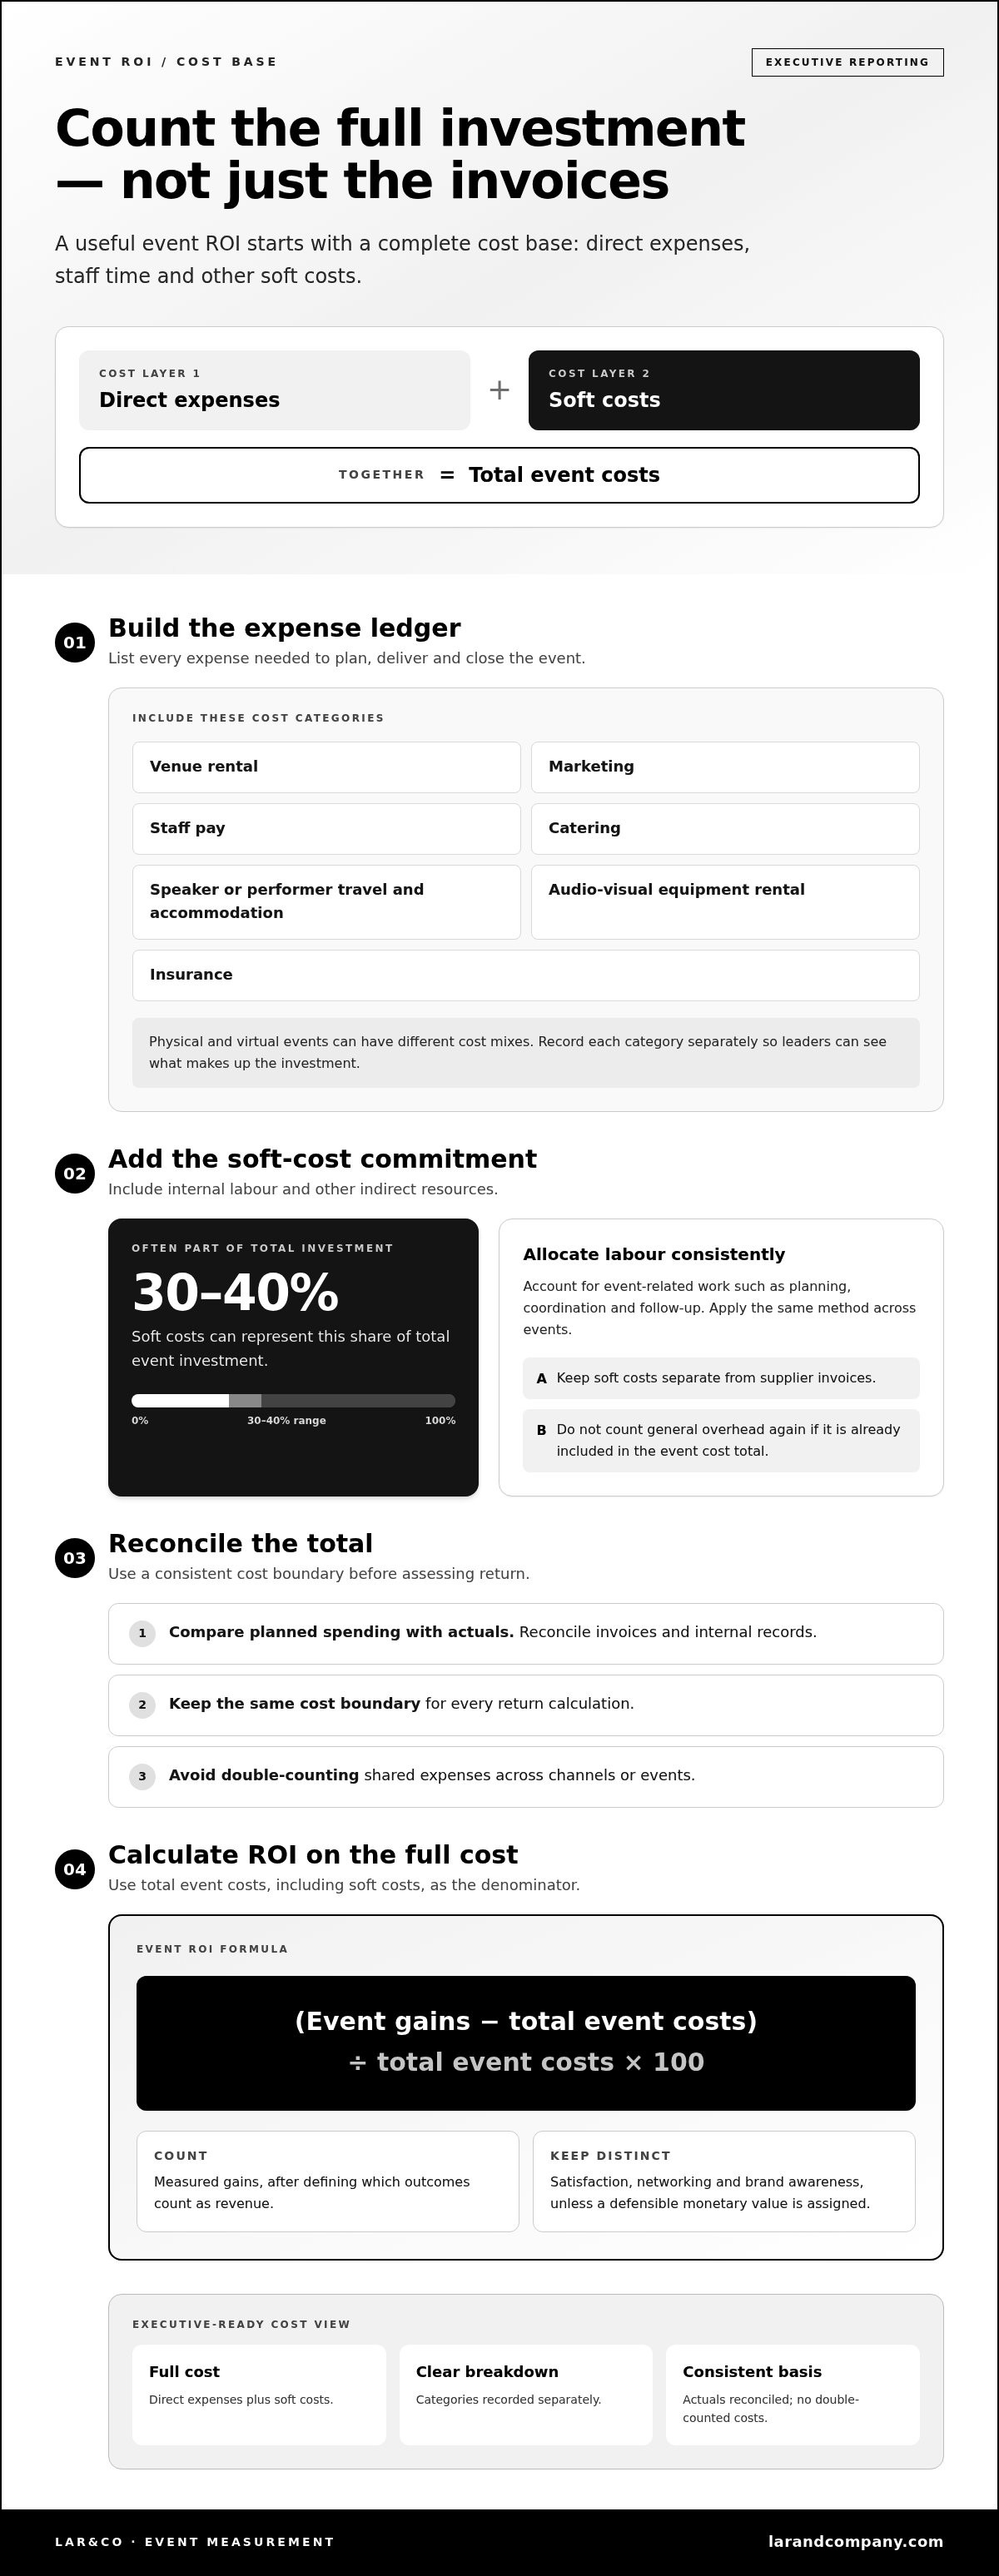
List every expense required to plan, deliver and close the event. Include venue rental, marketing, staff pay, speaker or performer travel and accommodation, catering, audio-visual equipment rental, and insurance.
Reconcile planned spending against actual invoices and internal records. Use the same cost boundary for every return calculation, and avoid counting a shared expense twice across channels or events.
The format affects which costs matter most. A physical conference may involve venue, catering and travel; a virtual event may concentrate spending elsewhere. Record each category separately so leaders can see which costs make up the largest share of the total investment.
•
Include soft costs in the calculation
Add internal labour and other indirect resources to the event ledger. Soft costs often represent 30-40% of total event investment, so excluding staff time can materially understate the amount committed.
Allocate staff pay according to event-related work, such as planning, coordination and follow-up. Apply the same method across events. Don’t count general overhead again if it is already included in the event cost total.
Record soft costs separately from supplier invoices. This lets executives compare cash expenses with the wider resource commitment without confusing the two.
•
Apply the ROI calculation to the full cost
Calculate event ROI by subtracting total event costs from event gains, dividing the result by total event costs, and multiplying by 100 to express the result as a percentage. Use the complete cost figure, including soft costs, as the denominator.
Include measured gains in the formula only after defining which outcomes count as revenue. Keep satisfaction, networking and brand awareness separate unless the organisation assigns them a defensible monetary value. This prevents non-financial outcomes from being presented as cash returns.
• Present the calculation with a short cost breakdown and a clear reporting period. Executives can then see whether the result reflects supplier spending alone or the full event investment, and which cost categories shaped the outcome.
Compare events only when their cost boundaries match. A format with substantial travel and venue requirements shouldn’t be judged against a virtual event using incomplete cost totals. Consistent categories make ROI more useful for planning and future budget decisions.
Tracking attendance and engagement
Measure attendance, engagement and follow-up alongside revenue. To assess event ROI, connect registration and participation records with CRM campaign influence, expenses and post-event outcomes.
• Build one tracking system before registration opens. Create a consistent event identifier, then use it across registration records, attendance logs, engagement activity and CRM campaign records. InEvent’s 2026 industry analysis found that 83% of event professionals tracked attendance, making attendance a clear operational measure. Keep fields consistent so leadership can compare records without reconciling conflicting labels.
• Record attendance separately from registration. Capture who registered, who attended and which sessions or activities they joined. For an executive forum, the example attendance was 40 senior decision-makers. That figure gives context to engagement and follow-up, but it doesn’t establish commercial impact by itself. Compare participant records with later opportunities to understand which contacts progressed.
• Define engagement using observable actions. Record session participation, questions, meetings booked and follow-up requests, rather than relying on a single attendance score. The example method categorises leads in the top 20% of engagement scores as highly engaged. Apply the same scoring rules to every contact, then compare high-engagement records with CRM outcomes.
• Connect each attendee record to the CRM campaign and opportunity history. Note whether a contact was already known, newly acquired or connected to an existing opportunity. This supports sourced-versus-influenced reporting without claiming attendance alone caused a sale. Use attendance, CRM campaign history, post-event sales data, attendee feedback forms and social media analytics together.
• Track expenses against the same event identifier. Match each entry to a category, event and reporting period, then reconcile totals with the final event ledger. Keep operational expenses distinct from engagement measures so leadership can see how investment relates to participation and outcomes. Complete records also let the team compare attendance and engagement with total spending.
• Close the loop with post-event actions. In the stakeholder report example, 61% of attendees scheduled a follow-up meeting, whilst 72% said they would attend the next event. Treat these as separate indicators: meetings signal near-term sales activity, while stated intent reflects satisfaction and future interest. Add both to the report, alongside CRM progress, so executives can assess immediate and continuing value.
Event ROI compared with KPIs and analytics
Set the event’s objectives before interpreting ROI. Then connect financial results, attendee feedback and platform activity to the measures leadership agreed to assess.
•
Review event financial data
Reconcile the final event ledger with ticketing, supplier and sales records before drawing conclusions. Separate closed revenue, qualified pipeline and projected revenue, then compare each with the same event objectives and reporting period. An executive report example shows $1.2 million in pipeline and $260,000 in projected revenue. Keep projected value labelled clearly, rather than presenting it as realised income.
•
Relate ROI to KPIs and analytics
Set KPIs before the event and involve management in defining the outcomes that matter. A sales event might track qualified opportunities, while a brand event could assess awareness and attendee feedback. Compare each result with its corresponding objective, not with a KPI designed for another format. This gives leadership context for interpreting ROI and separates commercial influence from non-financial value.
• Analyse social media activity against the event’s purpose. Review platform analytics for relevant mentions, audience interaction and engagement with event content, then connect those patterns with attendee feedback and other post-event data. A rise in activity alone doesn’t demonstrate revenue impact. For a brand-awareness objective, present social measures as evidence of reach or engagement, not closed sales.
• Use surveys, attendee feedback forms, social media analytics and post-event sales data together. Each method shows a different part of performance: feedback can indicate satisfaction, platform activity can reveal audience response, and sales data can show commercial outcomes. Compare each measure with the objective it serves. Don’t combine unrelated indicators into one score that obscures what the event achieved.
• Put measurement gaps in context for executives. According to InEvent’s 2026 industry analysis, 39% of event professionals tracked ROI measurement directly, whilst 40% said proving ROI was difficult. The same analysis found difficulty improved by 30 percentage points in one year. These figures underline the value of agreed definitions, linked data and consistent analysis.
• End the analysis with a decision tied to the evidence. If the event met its qualified-opportunity KPI but missed its attendance objective, identify which result should shape the next format or audience plan. Present the KPI, actual result, data source and recommended action together. This lets leadership assess financial return and broader outcomes without confusing correlation with proven influence.
Comparing event performance with other marketing channels
Compare events with other channels using shared objectives, cost definitions and attribution rules. Then show stakeholders which channel best supports the organisation’s priorities.
• Choose a common outcome before comparing channel performance. For a sales objective, assess qualified opportunities or closed revenue; for awareness, examine reach and audience response. A meeting booked through an event and a website conversion may reflect different stages of buyer intent. Label the outcome clearly so executives can compare like with like.
Set the same measurement window where practical. B2B event revenue may mature across a longer sales cycle than a paid campaign’s immediate conversions. State the window and attribution method beside each channel result, rather than treating different reporting periods as equivalent.
• Compare total investment using consistent cost boundaries. Include relevant labour and campaign delivery costs for each channel, not just media spend or venue invoices. If one channel’s cost per opportunity excludes internal resources while another includes them, the comparison will distort performance.
Present cost per opportunity alongside ROI. Treat it as a comparison point, not a universal target: audience, offer and opportunity quality shape what it means.
• Separate revenue from equivalent media value. A media mention might be valued at $5,000 in equivalent advertising spend, but that figure represents an estimated comparison, not sales revenue. Keep it in a distinct awareness or earned-media category, rather than adding it to closed deals.
This distinction helps leadership see what an event can deliver beyond immediate sales. Report media attention, attendee response and revenue as separate outcomes, then connect each to its original objective. Don’t let a large estimated media value conceal weak commercial performance.
• Use market evidence as context, not as a substitute for your own channel analysis. InEvent’s 2026 analysis found that 66% of respondents said in-person events generated the most revenue. That result signals the channel’s potential, but it doesn’t establish that every event outperforms every alternative.
Compare your organisation’s event data with its own campaign results. Check audience fit, opportunity quality, cost per outcome and the time required to deliver revenue. A channel with fewer conversions may still support higher-value relationships or strategic objectives.
• End with a decision stakeholders can act on. Show the strongest channel for each objective, the evidence behind that conclusion and the next adjustment. For example, retain an event for executive relationship-building while refining paid activity for demand capture, if the results support that division.
For a practical view of how live events are delivered, explore international live event projects. Use the comparison to guide investment, not to force every channel into one ranking.
Lar&Co: Show Production
Lar&Co, Producers of Live Entertainment, supports high-profile live events through Show Production, Technical Production, Site Management and Creative Direction. When a project’s scale or complexity calls for coordinated delivery, these disciplines help translate its objectives into a production plan. Financial Management supports oversight of the event’s financial framework, connecting planning decisions with cost reporting. Production execution doesn’t replace the organisation’s method for calculating ROI, so keep measurement tied to agreed KPIs, revenue definitions and attribution rules. The right production approach depends on the format, site requirements and project needs.
For your next event, contact Lar&Co to discuss the project.
Make measurement part of the next event
Use the next planning cycle to make measurement a design decision, not a report assembled after delivery. Give each objective an owner, agree how success will be recognised, and ensure the event experience supports the outcomes the organisation wants to create. This gives teams a clear basis for decisions as plans evolve.
A considered event ROI presentation for executives should lead to action, not simply record performance. Use the findings to shape the next brief: clarify the audience, intended experience and evidence leadership will need to assess its value. This keeps production decisions and business objectives aligned from the outset.
Lar&Co can bring production expertise to complex live projects. Discuss event measurement with Lar&Co as you develop your next event. A clear plan gives your team a stronger foundation for delivery and evaluation.
Frequently Asked Questions
What is event ROI?
Event ROI is the net value an event delivers relative to its total investment. Calculate it by subtracting event costs from event gains, dividing by those costs, then multiplying by 100. The result expresses return as a percentage. Interpret it alongside the event’s purpose: a networking event may support strategic relationships, whilst a sales event is more directly assessed through commercial outcomes.
What happens if event ROI is negative?
Negative ROI means the measured gains are lower than the costs within the chosen reporting period. First, check whether the calculation includes all relevant revenue and expenses, and whether the sales cycle has matured. Then identify the main shortfall: audience quality, attendance, follow-up or delivery. Use that diagnosis to decide what to change, rather than treating one result as a verdict on every future event.
What metrics should an event ROI presentation for executives include?
Include the ROI result, total investment, realised revenue and a clear separation between closed deals and anticipated value. Add a small set of measures tied to the event’s purpose, such as qualified opportunities, attendee satisfaction or senior-level meetings. Identify the reporting period and attribution method beside the figures. This lets executives see what has happened, what may develop and which measure supports each conclusion.
How should event costs be categorised in an ROI analysis?
Group costs into clear categories, such as venue, promotion, staffing, travel, catering, technical requirements and insurance. Separate external payments from internal labour, then distinguish costs directly tied to the event from shared overhead. This helps teams identify where spending sits and apply the same rules to future events. Keep a record of allocation decisions so changes in classification don’t distort comparisons.
How can you compare event ROI with other marketing channels?
Compare channels against the same business objective and a consistent attribution approach. For example, assess channels on qualified opportunities if lead generation is the goal, rather than comparing event attendance with digital impressions. For campaigns across the UK, US, UAE, Saudi Arabia and Qatar, account for market context and currency before drawing conclusions. Present differences in audience, sales stage and measurement window alongside the comparison.
How should event ROI results be summarised for an executive audience?
Lead with the decision the results support, then give the core outcome and its business context. Keep the main report focused on the event objective, investment, realised outcomes and the next recommended action. Put attribution assumptions and detailed calculations in supporting material. This gives executives a concise view without hiding how the result was reached or what remains to be measured.
What charts and visualisations work best in an executive event ROI presentation?
Choose visuals that answer a specific question. A waterfall chart can show how costs and gains contribute to net return, while a funnel can trace attendees through to qualified opportunities and closed deals. Use a simple trend chart to show results over the reporting period. Label projected and realised values distinctly, and avoid crowded dashboards that make different outcome types look equivalent.
What is a realistic event ROI benchmark by event type or industry?
There is no single benchmark; it depends on the event’s objective and industry. A 3:1 ROI may be strong for brand awareness but weak for a sales conference.